
File list
This special page shows all uploaded files.
| Date | Name | Thumbnail | Size | User | Description |
|---|---|---|---|---|---|
| 23:35, 24 June 2026 | summers2003.pdf (file) |  |
112 KB | Jlm | |
| 14:44, 5 May 2026 | Intestinal worms and human allergy.pdf (file) |  |
161 KB | John | |
| 01:36, 21 December 2025 | Inhibition of mast cell responses by ES-62.pdf (file) |  |
322 KB | John | |
| 00:49, 21 December 2025 | Worms tame mast cells.pdf (file) |  |
563 KB | John | |
| 06:18, 18 December 2025 | Sikder Trends-in-parasitology-2024.pdf (file) |  |
1.94 MB | Jlm | |
| 11:25, 29 November 2025 | Of Poops and Parasites.pdf (file) |  |
350 KB | John | |
| 20:03, 22 August 2025 | SobotkovaE et al 2019 HT review.pdf (file) |  |
1.29 MB | Jlm | |
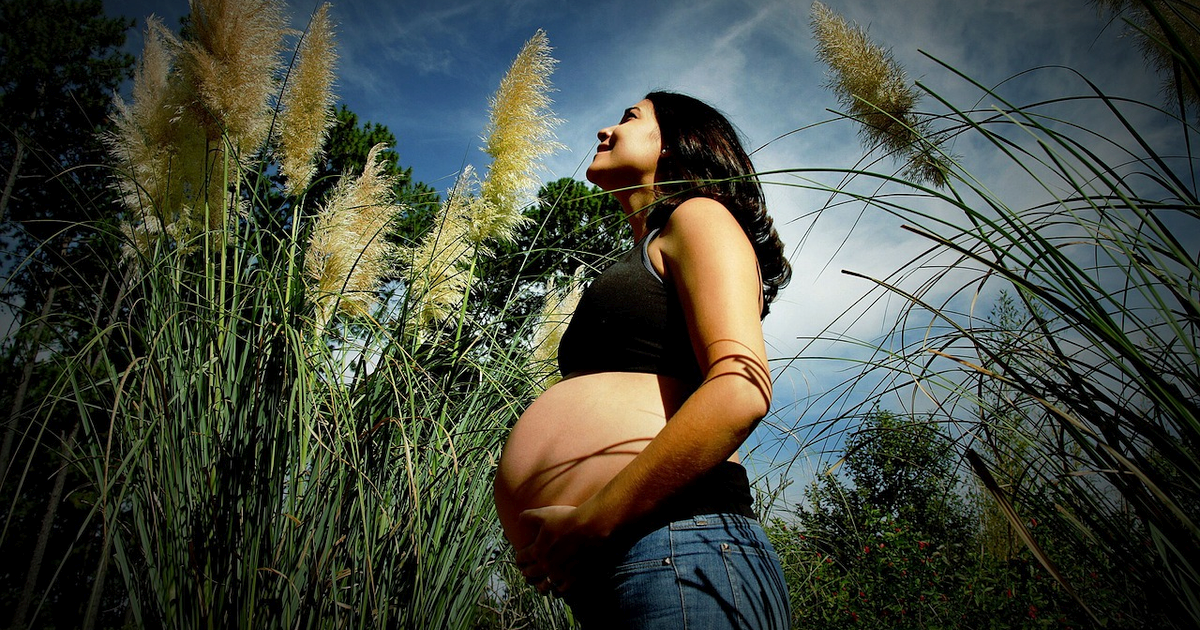
| 05:21, 21 July 2025 | pregnant lady 1200x630.png (file) |  |
2.17 MB | Laurel | source: https://www.needpix.com/photo/download/1132946/pregnant-woman-nature-happy-free-pictures-free-photos-free-images-royalty-free-free-illustrations |
| 23:01, 20 July 2025 | Helminthic therapy information for doctors.pdf (file) |  |
120 KB | Laurel | |
| 20:27, 3 February 2025 | pouring NA.mp4 (file) | 5.85 MB | Laurel | ||
| 00:06, 1 February 2025 | quartcontainer.png (file) |  |
215 KB | Laurel | |
| 23:08, 31 January 2025 | Number4filter.jpeg (file) |  |
36 KB | Laurel | |
| 15:44, 29 December 2024 | Helminths' therapeutic potential to treat intestinal barrier dysfunction.pdf (file) |  |
2.02 MB | John | |
| 00:33, 29 December 2024 | htbutton.png (file) |  |
45 KB | Laurel | |
| 23:32, 28 December 2024 | favicon.ico (file) | 15 KB | Laurel | Favicon 16 | |
| 23:24, 16 December 2024 | Using Worms to Treat Immune-Mediated Disease.pdf (file) |  |
1,011 KB | John | |
| 20:35, 13 November 2024 | Initial eosinophil counts in NA hosts.jpg (file) |  |
92 KB | John | |
| 20:04, 15 October 2024 | Medical researchers abandon therapy with living worms.pdf (file) |  |
229 KB | John | |
| 19:24, 11 October 2024 | Alternative therapeutic approaches to the treatment of periodontitis.pdf (file) |  |
107 KB | John | |
| 15:33, 27 September 2024 | Distribution of Autoimmune Disorders and Helminths.jpg (file) |  |
90 KB | John | |
| 22:12, 15 September 2024 | tp colandar2.jpg (file) |  |
23 KB | Laurel | |
| 22:07, 15 September 2024 | containers.jpg (file) |  |
99 KB | Laurel | Use a 32 oz / 1 lt container for best results. |
| 21:32, 15 September 2024 | colanda.jpg (file) |  |
33 KB | Laurel | Colander lined with toilet paper. Can flush everything once sample is taken. |
| 20:04, 15 September 2024 | microcentrifuge tube.jpg (file) |  |
3 KB | Laurel | 1.5 to 2 ml is possibly the best balance for size and ease of use. You don't need anywhere near that amount of liquid, but the smaller tubes are MUCH harder to put your larvae into. |
| 19:31, 15 September 2024 | disposable pipette sizes.jpg (file) |  |
23 KB | Laurel | I use 5 ml plus .5 ml disposable pipettes. Cut the tip of the .5 ml at a 45° angle. I do have an adjustable pipette and I do use it, but only because I bought it. Knowing what I know now, I wouldn't bother. |
| 19:20, 15 September 2024 | centrifugef tube with stand.jpg (file) |  |
14 KB | Laurel | The most useful of all supplies for incubating. |
| 18:30, 15 September 2024 | filter in yogurt container.jpg (file) |  |
2.17 MB | Laurel | |
| 18:25, 15 September 2024 | Applying feces to filter.jpg (file) |  |
1.35 MB | Laurel | |
| 21:36, 5 September 2024 | Tracy Cu's calprotectin levels.jpg (file) |  |
33 KB | Laurel | |
| 00:28, 29 August 2024 | Total Food Allergy Intolerance.pdf (file) |  |
487 KB | John | |
| 21:17, 30 June 2024 | Alternative therapeutic approaches for Crohn's disease.pdf (file) |  |
179 KB | John | |
| 20:51, 28 May 2024 | Gut Buddies - Multispecies Studies and the Microbiome.pdf (file) |  |
446 KB | John | |
| 17:44, 28 May 2024 | Parasites, ghosts and mutualists- a relational geography of microbes for global health.pdf (file) |  |
1,011 KB | John | |
| 01:25, 27 April 2024 | Overcoming Evolutionary Mismatch by Self-Treatment with Helminths.pdf (file) |  |
457 KB | John | |
| 05:56, 24 February 2024 | Tagline.png (file) | 587 bytes | Laurel | Tagline | |
| 05:52, 24 February 2024 | Wordmark.png (file) | 2 KB | Laurel | Logo for mobile | |
| 05:44, 24 February 2024 | Favicon.ico (file) | 894 bytes | Laurel | favicon for site | |
| 05:44, 24 February 2024 | Icon.png (file) |  |
39 KB | Laurel | Icon for site |
| 05:43, 24 February 2024 | Wiki.png (file) |  |
94 KB | Laurel | Logo for site |
| 18:46, 15 February 2024 | HOW TO find guides phone.jpg (file) |  |
242 KB | Laurel | |
| 17:31, 15 February 2024 | guides browser.jpg (file) |  |
85 KB | Laurel | |
| 19:33, 9 February 2024 | 283463832 325531943060869 4889262984253872896 n.jpg (file) |  |
175 KB | Laurel | The top chart shows all my Glucose Tolerance Tests overlay-ed on top of each other. This is helpful for comparing GTT results over time. Curves [1 - 6] are (NO helminth) baseline data. What I noticed is that each subsequent GTT test is worse then the prior. It consistently got worse over time. But after my NA inoculation (at curve 6), the T2D progression stopped. source: https://www.facebook.com/groups/htsupport/permalink/5021646394557942/ |
| 03:49, 4 February 2024 | Alternative therapeutic approaches for Ulcerative Colitis.pdf (file) |  |
188 KB | John | |
| 00:38, 20 January 2024 | Alternative therapeutic approaches for MS.pdf (file) |  |
146 KB | John | |
| 17:34, 18 January 2024 | Policy and regulations in light of the human body as a ‘superorganism’ containing multiple, intertwined symbiotic relationships.pdf (file) |  |
1.29 MB | John | |
| 20:06, 23 December 2023 | Intestinal worms eating neuropsychiatric disorders? Apparently so.pdf (file) |  |
538 KB | John | |
| 19:49, 23 December 2023 | Evolution of the hygiene hypothesis into biota alteration theory- what are the paradigms and where are the clinical applications?.pdf (file) |  |
1.89 MB | John | |
| 20:36, 20 December 2023 | Could these parasitic worms be good for your health?.pdf (file) |  |
113 KB | John | |
| 23:40, 17 November 2023 | Notes for prospective helminth providers.pdf (file) |  |
154 KB | John | |
| 04:28, 25 October 2023 | wiki.png (file) |  |
71 KB | Laurel |